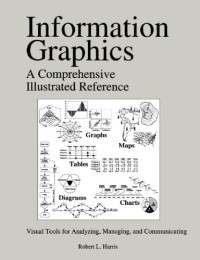
Information Graphics: A Comprehensive Illustrated Reference : Visual Tools for Analyzing, Managing, and Communicating
Robert L. Harris
This first-of-its kind reference makes available all essential and commonly needed material about information graphics. Its major focus is how charts, graphs, maps, diagrams, and tables are used as visual tools for analyzing, managing, and communicating. The book defines, explains, categorizes, illustrates, and cross-references over 850 entries which are arranged alphabetically for quick and easy access. In addition to complete graphics, specific construction details and variations are reviewed in depth. More than 3,000 self-explanatory graphics complement the text. No special knowledge of mathematics or graphics is required to fully benefit from the book's contents.
From Scientific American
This book will be particularly useful to people doing desktop publishing, will help introduce general readers to the language of graphic designers, and can be used as a guidebook for finding the best way to present graphic information. Recommended for all levels.
From The New Yorker
The breadth and depth of entries, examples, and cross-references are almost overwhelming. The book's 448 pages pack in more than 850 entries and nearly 4,000 illustrations covering everything from mundane pie charts to complex visualization techniques for data analysis and business operations. Readers can explore subjects to the depth necessary--it's all there. The writing is straightforward and precise without being overly technical, and presupposes no special knowledge of graphics or
…
Kateqoriyalar:
İl:
1996
Nəşriyyat:
Oxford University Press, USA
Dil:
english
Səhifələr:
450
ISBN 10:
0964692503
ISBN 13:
9780964692503
Fayl:
PDF, 39.03 MB
IPFS:
,
english, 1996
 Amazon
  Barnes & Noble
  Bookshop.org
Kitab mağazasını əlavə etmək istəyirsiniz? Bizimlə support@z-lib.do ilə əlaqə saxlayın
 Faylları çevirin
 Daha çox axtarış nəticəsi
 Digər üstünlüklər


Açar ifadələr
Əlaqəli Kitab Siyahıları